Turn messy data into clear decisions.
We design dashboards and data reports that busy teams actually use: clean, accurate and easy to read at a glance. From spreadsheets to live, interactive insights.
What we build for you
Every project starts with one question: what decision does this data need to support? Then we build exactly that: dashboards, reporting and practical AI.
Interactive dashboards
Power BI, Tableau, Looker Studio or web dashboards with filters, drill-downs and clear KPIs.
Data cleaning & structuring
Messy spreadsheets and survey exports turned into tidy, reliable datasets ready for analysis.
Analysis & insights
Trends, comparisons and key findings, explained in plain language with charts that tell the story.
Automated reporting
Monthly and quarterly reports that update themselves, saving your team hours every cycle.
M&E and KPI frameworks
Indicator tracking and results dashboards for programmes, projects and donor reporting.
Infographics & data visuals
Publication-ready charts, one-pagers and visual summaries for reports and presentations.
Explore our live dashboards
Real, interactive dashboards for development, sustainability and business audiences. Open any one and try the filters. Our AI demos are in the next section.
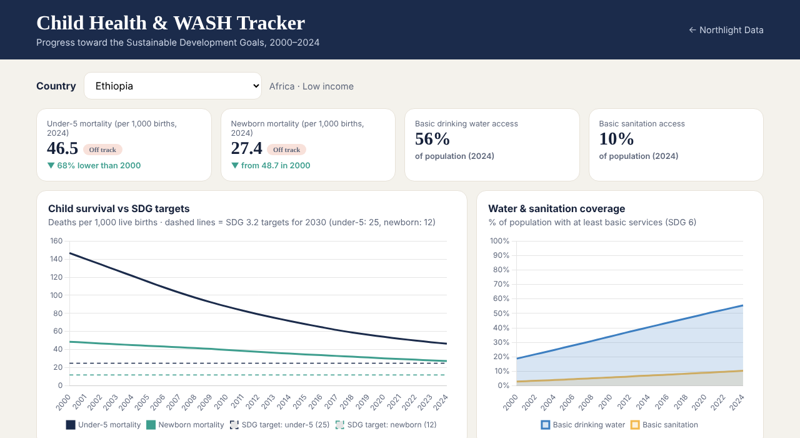
Child Health & WASH Tracker
Under-5 and newborn mortality against SDG targets, water and sanitation access, on-track status and a regional snapshot for 199 countries.
Open dashboard →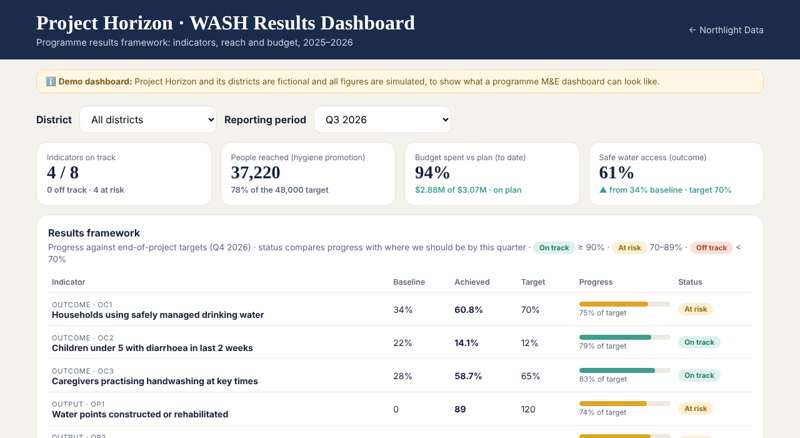
Programme Results (M&E) Dashboard
A donor-ready results framework: indicators vs targets with on-track status, reach by sex and age, budget burn and district comparison.
Open dashboard →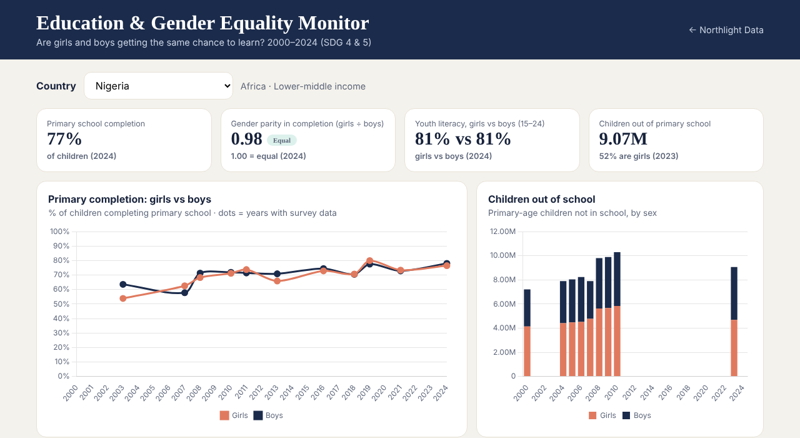
Education & Gender Equality Monitor
Primary completion for girls vs boys, gender parity, youth literacy and out-of-school children across 144 countries.
Open dashboard →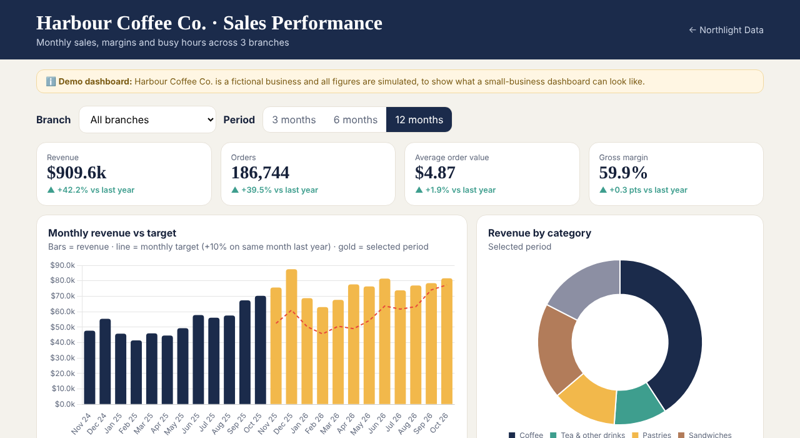
Small Business Sales Performance
Revenue vs target, margins, branch comparison, best-selling categories and a busy-hours heatmap for smarter staffing.
Open dashboard →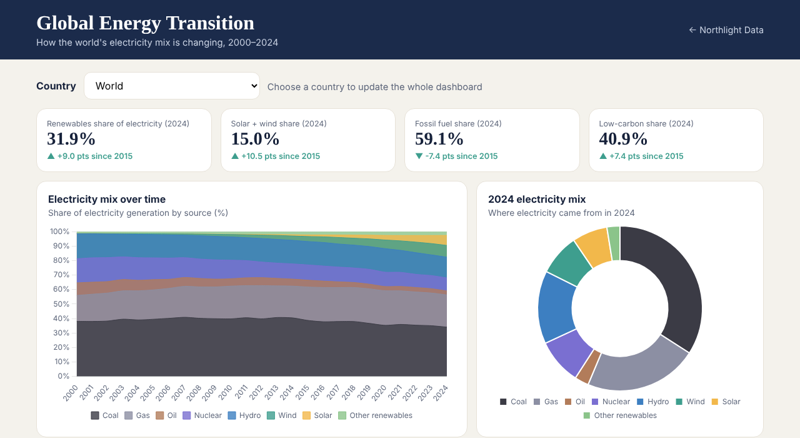
Global Energy Transition
How 138 countries generate electricity, from coal to solar, 2000–2024, with KPIs, rankings and auto-generated insights.
Open dashboard →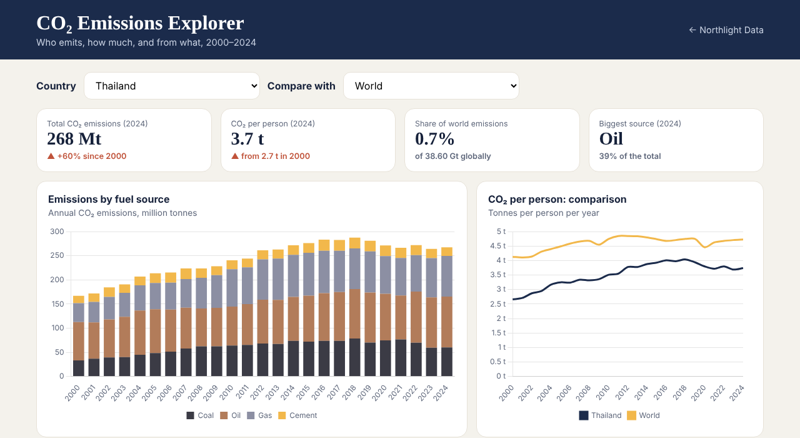
CO₂ Emissions Explorer
Compare emissions by country, fuel source and per person, with side-by-side country comparison and a bubble chart of all nations.
Open dashboard →Energy, CO₂, health and education dashboards use public data (Our World in Data; UN IGME, WHO/UNICEF and UNESCO via Gapminder). The programme M&E, small-business and AI demos use fictional data. Client work is kept confidential.
Put AI to work on your data
Practical, responsible AI that saves your team hours, built on your own data and tools.
Try our live AI demos
Real AI, fictional data · tap any demo to try it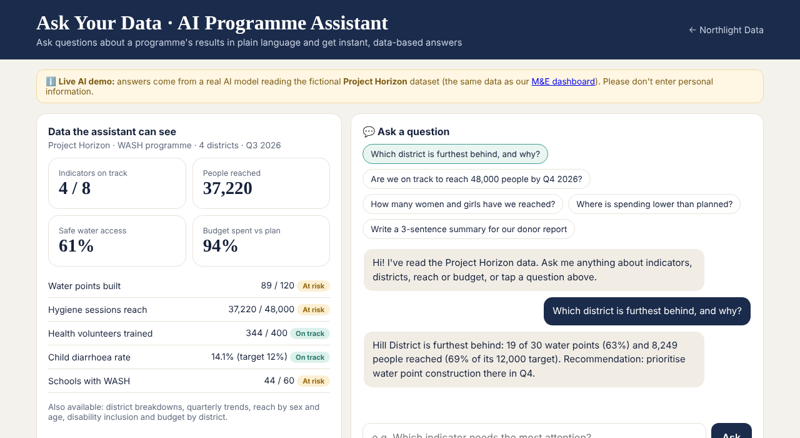
AI Programme Assistant
Ask questions about a programme's results in plain language ("Which district is behind?") and get instant answers from the data, plus donor-ready summaries.
Try the AI demo →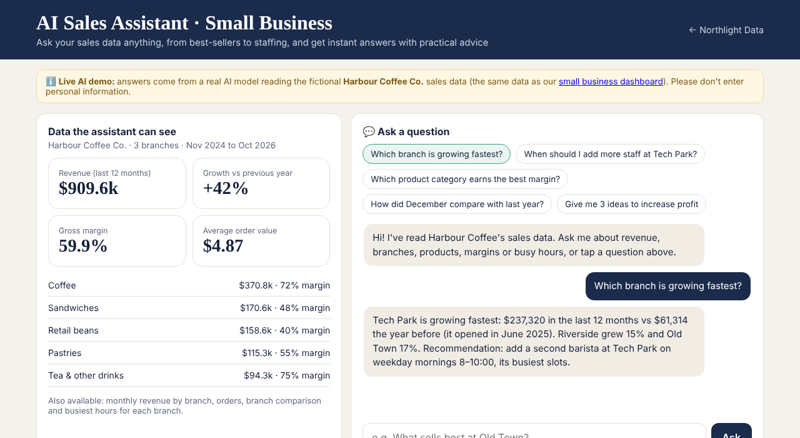
AI Sales Assistant
A small business owner asks "Which branch is growing fastest?" or "When should I add staff?" and gets instant answers and practical ideas from their sales data.
Try the AI demo →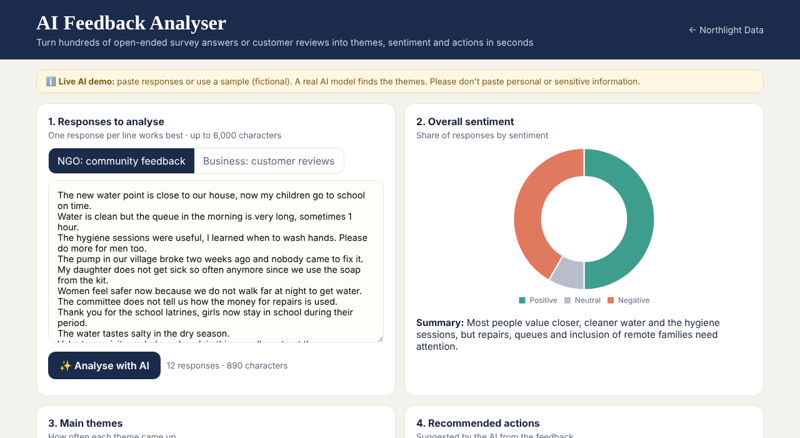
AI Feedback Analyser
Paste survey answers or customer reviews and get themes, sentiment, example quotes and recommended actions in seconds.
Try the AI demo →Built for clarity, not complexity
Decision-first design
We start from the decisions you need to make, then show only the numbers that matter.
Plain-language insights
Every dashboard comes with clear takeaways that anyone on your team can understand.
Works with your tools
We build in the tools you already use, so there's no new software to learn.
Confidential & careful
Your data stays private, and we follow responsible data practices throughout.
A simple, clear process
From first conversation to final handover, you always know what's happening next.
Discuss
You share your goals, data and audience. We agree on what success looks like.
Design
We sketch the layout and key metrics so you see the plan before we build.
Build
We clean and connect your data, then turn it into a polished, tested dashboard.
Deliver
We hand over with a short guide and refine it until it fits your team perfectly.
Let's talk about your data.
Tell us a little about your project. We'll reply within 1–2 working days to discuss your needs and next steps.
- Free initial discussion
- Solutions tailored to your needs and budget
- Confidential: your data stays private